
Hidden NHS eye care delays risk avoidable sight loss for patients – but solutions are available NOW

Newmedica logo – Eye health clinics + Surgical Centres
Hidden delays in NHS eye care are putting patients at risk of avoidable sight loss, a new report warns – despite solutions being available now to address the issue.
The report, being launched in the Houses of Parliament on 15 July, highlights how a lack of transparency over waiting times – particularly for follow-up care – is creating avoidable clinical risk as demand rises and NHS capacity remains constrained.
Nigel Kirkpatrick, consultant ophthalmologist and medical director at Newmedica.‘As eye health and patient champions, Newmedica is taking this report to the heart of government because of this hidden risk to patients. The good news is that there are steps that can be taken now by government and commissioners to prevent avoidable sight loss. As set out in the report, these include improving transparency, enabling genuine patient choice and making more effective use of existing capacity within the NHS and the independent sector.’
Patient choice refers to the legal right of patients in England to choose their healthcare provider at the point of referral.
Mr Kirkpatrick‘Patient choice can help drive the health service to be more responsive to patient need. But it must be genuine choice. That means that patients and health commissioners need clear visibility of information about NHS follow-up waiting times. It would empower patients to be able to make more informed decisions about their care. For health commissioners, they can plan effective services informed by data to meet patient need for wet AMD and glaucoma for example.’
Key findings:
- Hidden waiting lists for glaucoma and wet age-related macular degeneration (AMD) are increasing risk of avoidable sight loss
- Patients on ophthalmology follow-up waiting lists face a ninefold risk of avoidable sight loss compared to new patients
- Enabling genuine patient choice could improve access to timely care
- Better use of NHS and independent sector capacity – supported by community optometrists – could reduce delays
System pressure
The report highlights how in England around one in 12 patients awaiting first appointments for specialist treatment are in ophthalmology.
More than 11.4 million people are awaiting follow-up care across all specialities, yet there is no requirement to record and publish data on follow-up waiting times. The lack of transparency is leading to patients being ‘lost in the system’ and facing deteriorating health due to long delays.
Risks are particularly acute for chronic conditions such as glaucoma and wet age-related macular degeneration (AMD), where delays in monitoring or treatment can lead to irreversible sight loss. Patients on follow-up waiting lists face a ninefold risk of avoidable sight loss compared with new patients.
Newmedica-commissioned research by Cambridge Economics Policy Associates shows waiting list pressure increased by between 10 and 30 per cent across many integrated care boards (ICBs) during 2025, indicating that patient need continues to outstrip available treatment capacity. ICBs commission regional NHS services in England.
Variation in care delivery also points to underuse of existing capacity. AMD injection rates – which prevent further sight loss – range from 2.6 per cent to 14 per cent per 100,000 people across ICBs, suggesting differences in access rather than patient need. The research found the expected rate was 10 percent.
Mr Kirkpatrick‘Capacity exists across both NHS and independent providers. But it is not consistently commissioned in line with patient need - limiting access to care and increasing clinical risk. The system must make better use of all high-quality capacity available to it – including expert optometrists.’
The report calls for:
- Mandatory publication of ophthalmology waiting times by condition, including follow up care
- Consistent commissioning of NICE-recommended treatments using all available clinical capacity
- Expansion of integrated pathways, led by consultants and supported by community-based optometrists.
- Full IT integration across all providers
You can read the report in full here: www.newmedica.co.uk/championing-eye-health
England’s blind spots
Against a backdrop of patients struggling to access eyecare and a system overwhelmed by rising demand, Newmedica commissioned Cambridge Economics Policy Associates (CEPA) to investigate eyecare waiting lists and relative ICB level ‘gaps’ between age-adjusted prevalence of serious eye conditions and treatment delivered. The findings are set out in the new report by Newmedica.
Five eye care metrics for wet AMD, glaucoma, cataract, overall outpatient activity and overall eye care burden were developed. Analysis used publicly available data including prevalence estimates from the UK Eye Care Data Hub and was undertaken using ICB boundaries before April 2026. Pressure on waiting lists show 10–30% growth across many ICBs.
Using NHS Referral to Treatment data, pressures on waiting lists for eye care – as measured by additional referrals relative to completes pathways – have risen for most of ICBs during 2025. This measure is used as headline waiting list totals may mask pressures if patients are removed via re coding. It indicates that demand for care is outstripping the availability of treatment.
When the five metrics are combined, many of the ICBs with the greatest gap between prevalence estimates and treatment rates cluster around London and the South East. Three ICBs are ranked in the bottom half of ICBs for all five metrics: Surrey Heartlands; Buckinghamshire, Oxfordshire and Berkshire West; and Mid and South Essex.
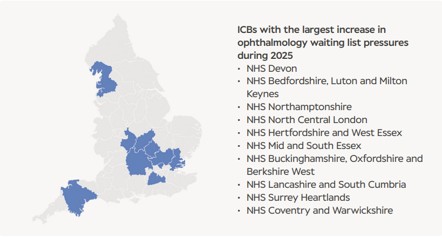
Image 1: ICBs with the largest increase in ophthalmology waiting list pressures during 2025 represented by a map of England with areas highlighted in blue.
- NHS Devon
- NHS Bedfordshire, Luton and Milton Keynes
- NHS Northamptonshire
- NHS North Central London
- NHS Hertfordshire and West Essex
- NHS Mid and South Essex
- NHS Buckinghamshire, Oxfordshire and Berkshire West
- NHS Lancashire and South Cumbria
- NHS Surrey Heartlands
- NHS Coventry and Warwickshire
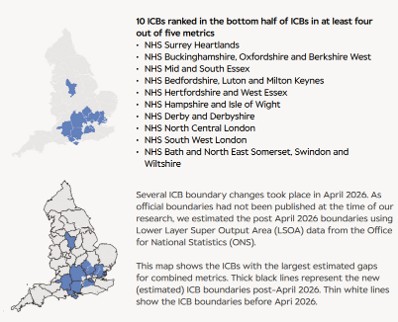
Image 2: 10 ICBs ranked in the bottom half of ICBs in at least four out of five metrics, illustrated by a map of England with areas highlighted in blue.
- NHS Surrey Heartlands
- NHS Buckinghamshire, Oxfordshire and Berkshire West
- NHS Mid and South Essex
- NHS Bedfordshire, Luton and Milton Keynes
- NHS Hertfordshire and West Essex
- NHS Hampshire and Isle of Wight
- NHS Derby and Derbyshire
- NHS North Central London
- NHS South West London
- NHS Bath and North East Somerset, Swindon and Wiltshire
Text next to bottom map says “Several ICB boundary changes took place in April 2026. As official boundaries had not been published at the time of our research, we estimated the post 2026 boundaries using Lower Layer Super Output Area (LSOA) data from the Office of National Statistics (ONS).
This map shows the ICBs with the largest estimated gaps for combined metrics. Thick black lines represent the new (estimated) ICB boundaries post-April 2026. Thin white lines show the ICB boundaries before April 2026.”
Ends
Join our mailing list
If you are a Visionary member or partner and would like to receive regular news and updates about our work, then you can sign up to our mailing list.
You can find out more about becoming a Visionary member on our Eligibility and Pricing page